In the world of real estate, there are several key metrics that buyers and sellers should pay attention to when making important decisions. These metrics provide valuable insights into the current state of the market and can help guide individuals in their buying or selling strategies. Today, we will explore the correlation between the following real estate metrics: Months Supply of Inventory, 12-Month Change in Months of Inventory, Median Days Homes are On the Market, List to Sold Price Percentage, and Median Sold Price.
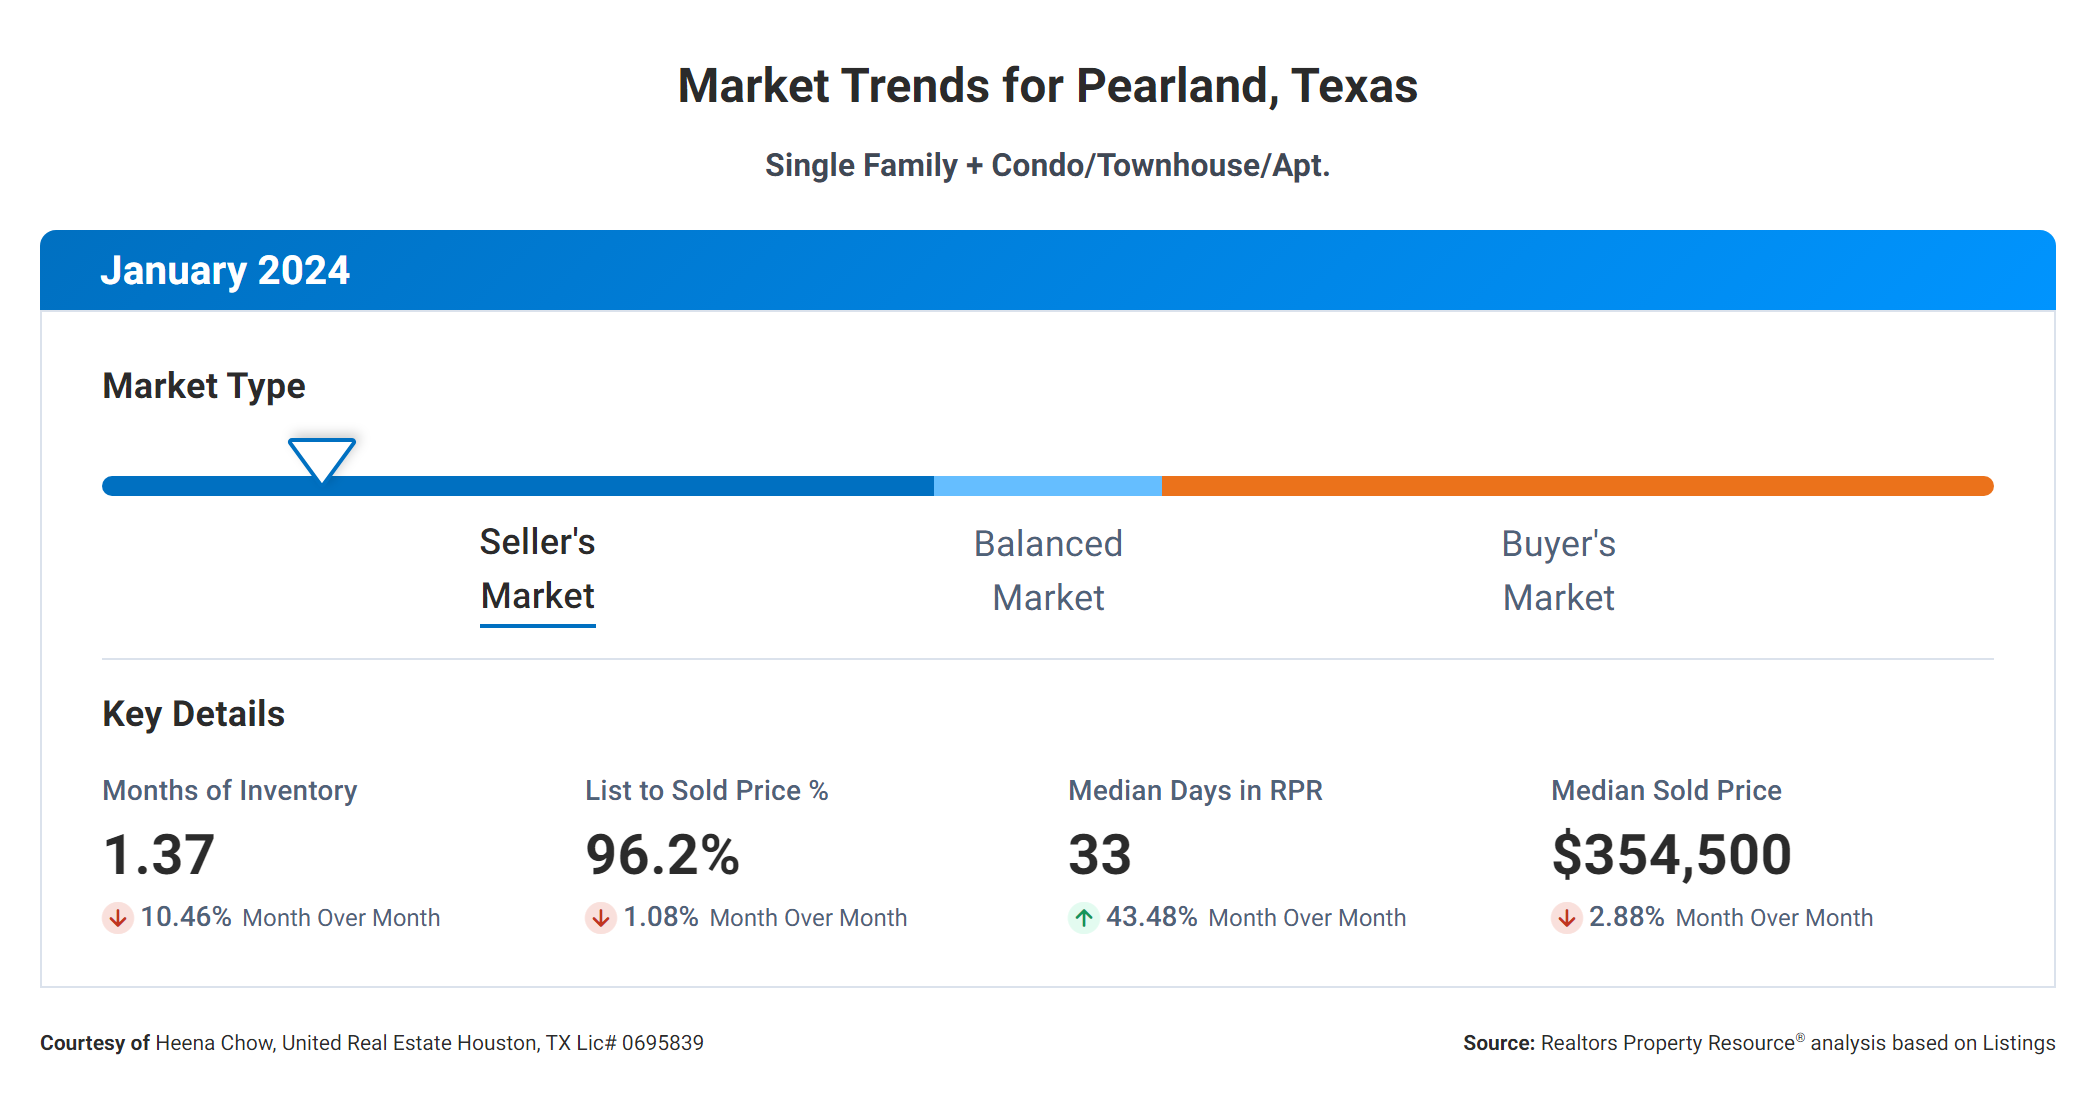
Firstly, let's take a look at the Months Supply of Inventory, which currently stands at 1.37. This metric measures the number of months it would take to sell all the available homes on the market if no new listings were added. A lower number indicates a seller's market, where demand is high and supply is low. In this case, the low supply suggests that there is a high level of competition among buyers for the available homes.
Next, we have the 12-Month Change in Months of Inventory, which shows a decline of -0.72%. This metric represents the percentage change in the supply of homes over the past year. A negative change suggests that the supply has decreased, indicating a tightening market. With a decrease of 0.72%, we can infer that the real estate market has become more competitive over the past year, with fewer homes available for buyers to choose from.
Moving on to the Median Days Homes are On the Market, we find that homes are spending an average of 33 days on the market before being sold. This metric highlights how quickly properties are being snapped up by buyers. A lower number suggests a fast-paced market with high demand. In this case, the relatively short time frame indicates that homes are selling quickly, indicating strong buyer interest.
The List to Sold Price Percentage is another crucial metric, currently standing at 96.2%. This metric measures the percentage of the original listing price that a home ultimately sells for. A higher percentage indicates that homes are selling close to their initial asking price. With a percentage of 96.2%, we can conclude that sellers are achieving a high percentage of their original listing price, suggesting that buyers are willing to pay close to the asking price.
Lastly, we have the Median Sold Price, which is currently at $354,500. This metric represents the middle point of all the sold prices, with half of the homes selling above this price and half selling below it. The median sold price provides a snapshot of the current market value. In this case, a median sold price of $354,500 suggests that this is the prevailing market price for homes in the area.
Now, let's discuss the correlation between these metrics. The low Months Supply of Inventory, combined with the decreasing 12-Month Change in Months of Inventory, indicates a tight market with limited supply. This scarcity of homes drives up demand and can potentially lead to higher prices, as evident in the high List to Sold Price Percentage.
Additionally, the short Median Days Homes are On the Market further reinforces the high demand and fast-paced nature of the market. Buyers need to act quickly and be prepared to make competitive offers to secure a property.
Finally, the Median Sold Price of $354,500 provides a benchmark for both buyers and sellers. Buyers can use this information to gauge whether the prices they encounter are in line with the market, while sellers can use it to set realistic listing prices.
In conclusion, these real estate metrics reveal a market that strongly favors sellers due to low supply, high demand, and a tendency for homes to sell close to their asking prices. Buyers should be prepared for a competitive environment with limited options, while sellers can expect strong interest and the potential for a successful sale at or near their desired price.
If you enjoyed this post, please consider sharing it with others. ![]()

items