Ladies and gentlemen, today we will be discussing some key real estate metrics that are of great importance to both buyers and sellers in the market. These metrics provide valuable insights into the current state of the real estate market and can help inform your decision-making process.
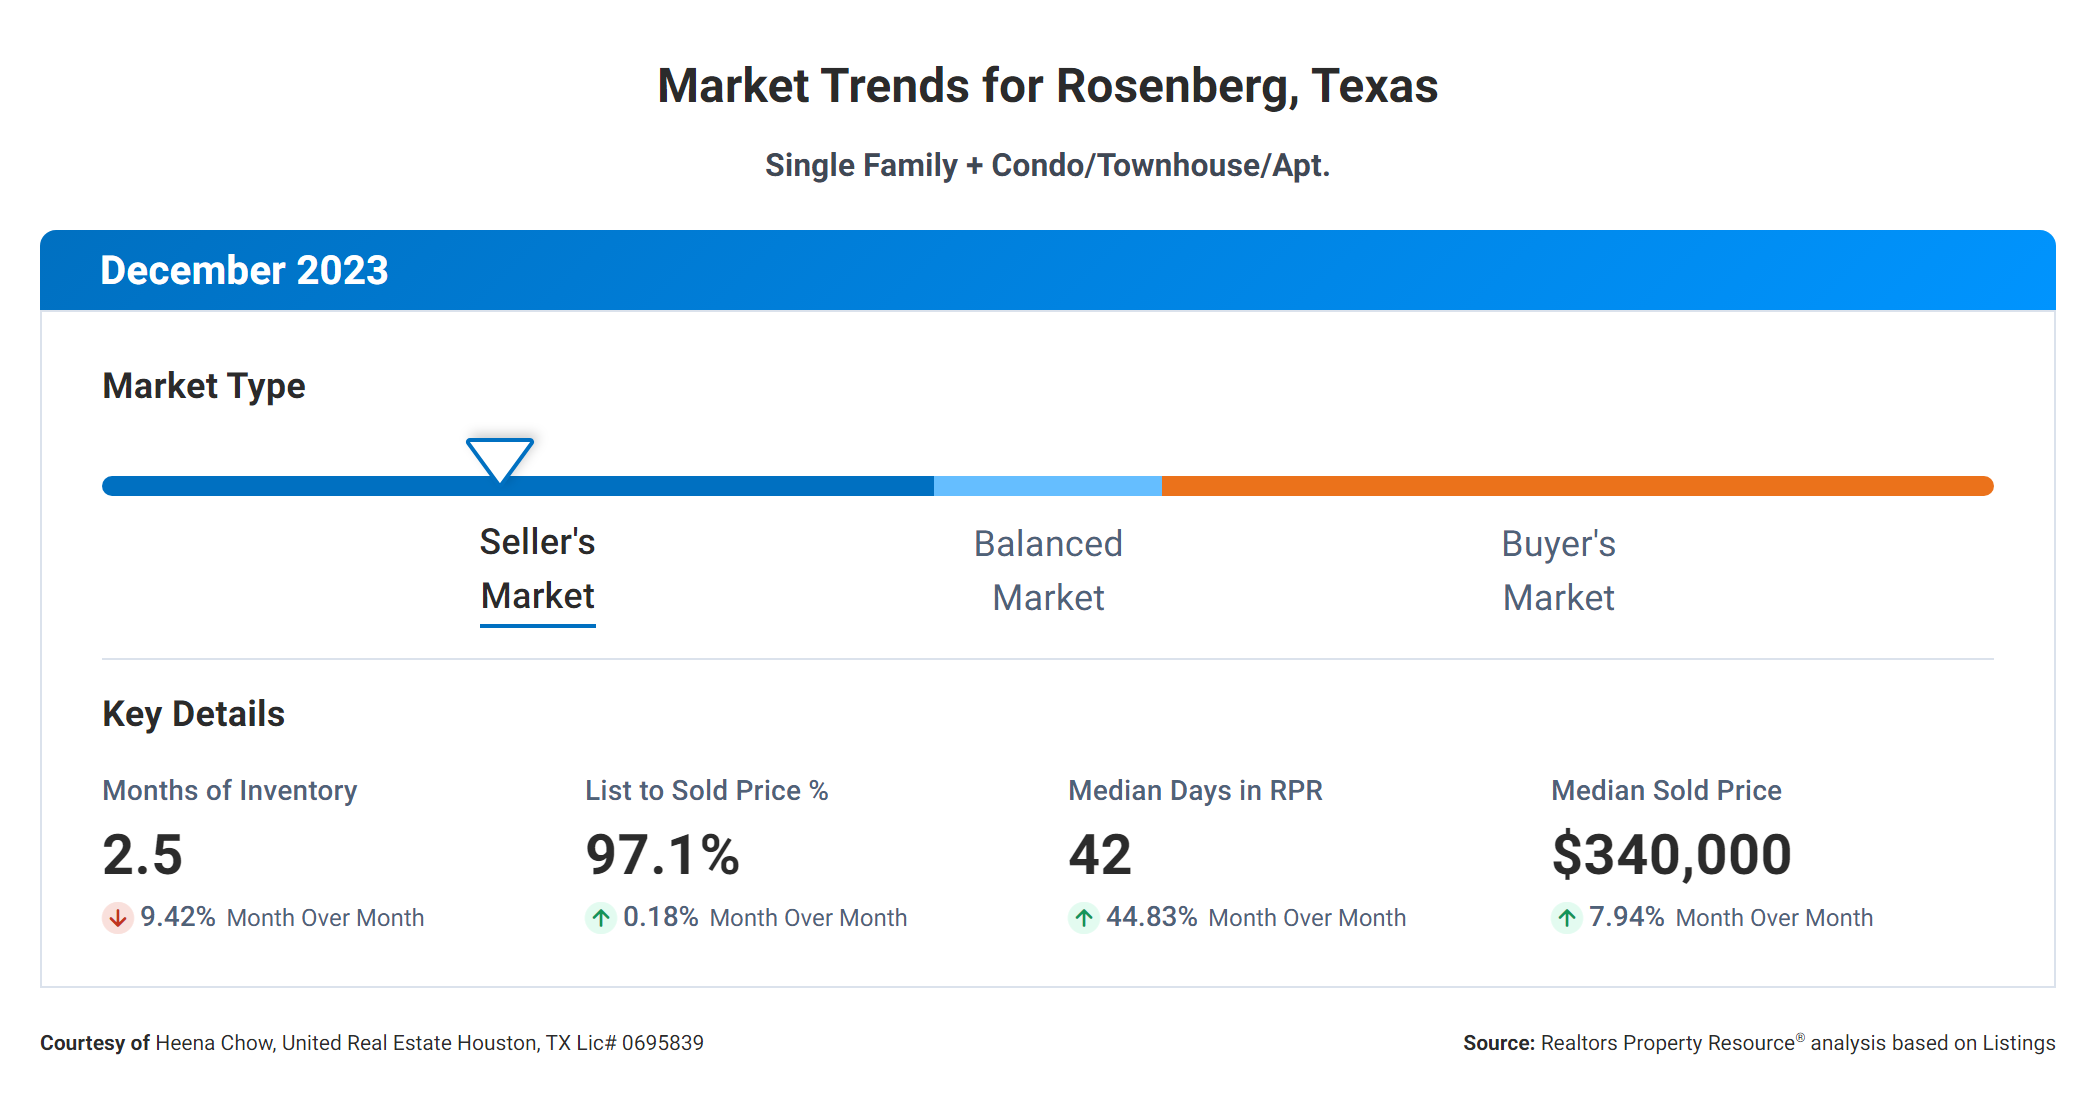
Firstly, let's take a look at the "Months Supply of Inventory." This metric represents the number of months it would take to sell the current inventory of homes on the market, given the current sales pace. In our analysis, we find that the Months Supply of Inventory is 2.5. This indicates a relatively balanced market, where the demand for homes is roughly in line with the available supply.
Now, let's focus on the "12-Month Change in Months of Inventory." This metric measures the percentage change in the Months Supply of Inventory compared to the same period last year. In our case, we observe a significant increase of 28.87%. This suggests that the market has become more favorable for buyers, as there is a greater supply of homes available compared to the previous year.
Moving on, we have the "Median Days Homes are On the Market." This metric indicates the average number of days it takes for a home to sell once it is listed. Our analysis reveals that homes are typically on the market for 42 days. This relatively short timeframe suggests a healthy demand for homes and a competitive market where properties are selling relatively quickly.
Next, we have the "List to Sold Price Percentage." This metric represents the percentage of the listing price that homes are actually sold for. In our analysis, we find a List to Sold Price Percentage of 97.1%. This indicates that, on average, homes are selling very close to their listing price. This is positive news for sellers, as it suggests that buyers are willing to pay a fair price for properties.
Lastly, we have the "Median Sold Price," which is the middle point of all the homes sold in a given period. Our analysis shows that the Median Sold Price is $340,000. This figure provides a benchmark for both buyers and sellers, giving them an idea of the typical price range they can expect in the current market.
In conclusion, these real estate metrics provide valuable insights into the current state of the market. The Months Supply of Inventory and the 12-Month Change in Months of Inventory indicate a balanced market with an increasing supply of homes. The Median Days Homes are On the Market suggests a competitive market where properties are selling relatively quickly. The List to Sold Price Percentage indicates that homes are selling close to their listing price, and the Median Sold Price provides a benchmark for buyers and sellers. Overall, these metrics provide a comprehensive snapshot of the real estate market, allowing buyers and sellers to make informed decisions.
If you enjoyed this post, please consider sharing it with others. ![]()

items